Unique Pump Systems, Kailash Industrial Complex, Vikhroli (W)
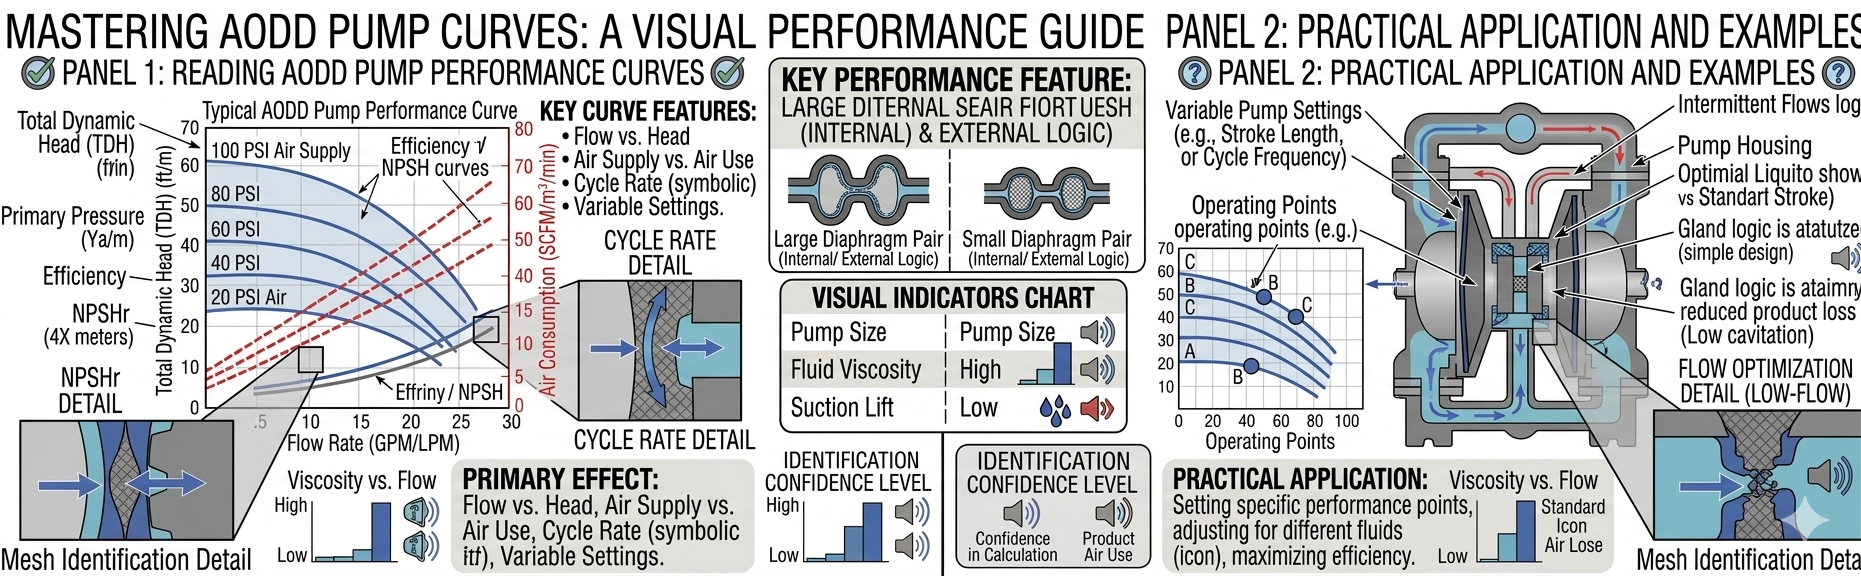
An AODD pump performance curve is the most important document for selecting the right AODD pump for your application and for verifying that an installed pump will deliver the required flow at your system conditions. Unlike a centrifugal pump single H-Q curve, an AODD pump performance chart contains multiple curves — typically one for each supply air pressure — and an additional air consumption axis. Reading it correctly takes approximately 5 minutes with this guide.
📖 Read More: AODD Pumps vs EODD Pumps
| Axis | What It Shows | Units | Position on Chart |
|---|---|---|---|
| X-axis (horizontal) | Flow rate — the volume of fluid delivered per unit time | LPM (litres per minute) or GPM | Bottom axis |
| Y-axis left (vertical left) | Discharge head — the pressure against which the pump discharges, expressed as head height | Metres of head (or bar, or PSI) | Left side axis |
| Y-axis right (vertical right) | Air consumption — the volume of compressed air consumed per unit time | Nm³/hr or SCFM | Right side axis |
| Multiple performance curves | Each curve = one specific supply air pressure. Higher supply pressure = higher curve (more head and more flow possible). | See legend on chart | Multiple lines across the chart area |
| Operating Position on Curve | Flow Rate | Air Consumption per Litre Delivered | Efficiency Assessment |
|---|---|---|---|
| Far left of curve (very low flow, high head) | Low | High — slow strokes but high pressure per stroke | Poor efficiency — consider a smaller pump |
| Middle of curve (moderate flow, moderate head) | Moderate | Lowest air per litre — optimal efficiency | Best efficiency point — target this range |
| Far right of curve (high flow, low back-pressure) | High | Moderate — fast strokes but low pressure per stroke | Moderate efficiency — acceptable but maximum stroke rate increases wear |
| Above maximum curve (point not reachable) | N/A | N/A | Impossible operating point — increase supply or select larger pump |
| Feature | AODD Pump Curve | Centrifugal Pump Curve |
|---|---|---|
| Number of curves | Multiple — one per supply air pressure | One (at rated motor speed) — or family for VFD operation |
| Flow at high back-pressure | Decreases as stroke rate slows — but pump continues operating | Decreases as operating point moves left on H-Q curve |
| Flow at low back-pressure | Increases as stroke rate increases (more strokes per minute) | Increases as operating point moves right on H-Q curve |
| Stall condition | Pump stops if back-pressure exceeds supply air pressure — safe, no damage | Pump runs at shutoff head — recirculates fluid, builds heat — damaging |
| Air / energy consumption axis | Yes — right-hand axis shows air use | No — efficiency shown as separate efficiency curve or not at all |
| Effect of higher supply pressure | Entire curve family shifts up and right — can develop more head and flow | Cannot increase head/flow without increasing motor speed (VFD required) |
Application: chemical transfer, required flow 80 LPM, system back-pressure 3 bar (30.6 metres head), suction lift 2 metres.
It means even the lowest supply air pressure shown on the chart (typically 2 bar) can deliver your required flow at your back-pressure with margin to spare. You may be able to use a smaller pump model — check if a smaller size's performance chart covers your operating point. Running a pump significantly larger than needed wastes air, increases noise, and increases diaphragm wear rate.
You cannot achieve the required operating point with this pump at the maximum rated supply pressure. Options: increase supply pressure if the pump is rated for it (check maximum rated pressure in the datasheet); or select a larger pump model whose performance curve covers your operating point.
Because AODD pump performance changes with supply air pressure — unlike a centrifugal pump at fixed motor speed, the AODD pump's pressure and flow capability varies continuously with the supply air pressure. Each line on the chart represents one specific supply air pressure, giving you a family of operating possibilities. The air regulator on the supply line lets you select which curve to operate on.
At zero flow (fully closed discharge), the AODD pump stalls — the diaphragm cannot move against the back-pressure because it equals the supply air pressure. The pump stops safely and restarts automatically when discharge pressure drops. This is the safe dead-head condition — no damage to the pump, unlike the centrifugal pump's overheating dead-head condition.
📖 Read More: AODD Pump vs Centrifugal Pump
Unique Pump Systems manufactures air operated double diaphragm pump in the full range of sizes and materials. Performance curves are available for all pump models on request. Contact our technical team for operating point verification and pump sizing support.